The small add-on for better entries. Calor shows you where the most action was at recent prices.
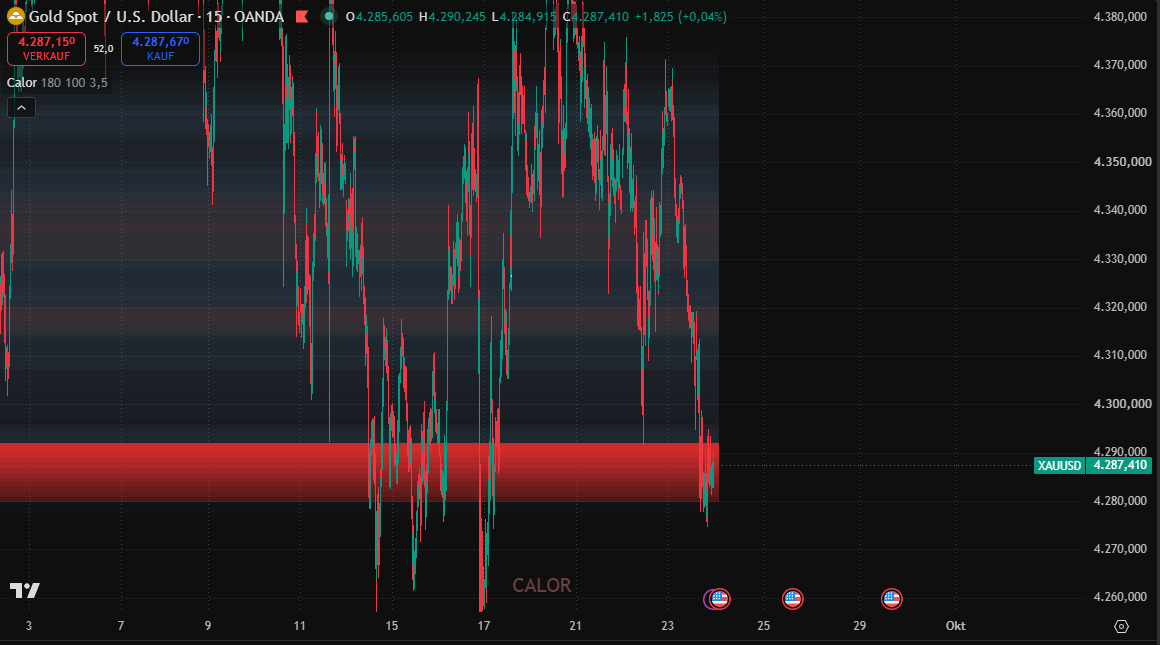 Real chart
Calor on the 15-minute chart: red means this is where the most action was recently. That is exactly where price often reacts.
From volume, time at price and reversal points, in one picture.
Only counts real highs and lows, not every candle.
Purple for low, blue for medium, red for high. Smooth transitions instead of hard blocks.
As an add-on to Aureus, Velox or Tempus, for better entries and analysis.
Calor does not replace an indicator. It sits under your existing one and shows where the important zones are. That way you plan entries and targets more precisely.
The heatmap add-on for TradingView.
 Indikator