For trades that run over hours and days. Golden zone, market structure, eight timeframes and the news of the week in one chart.
 Real chart
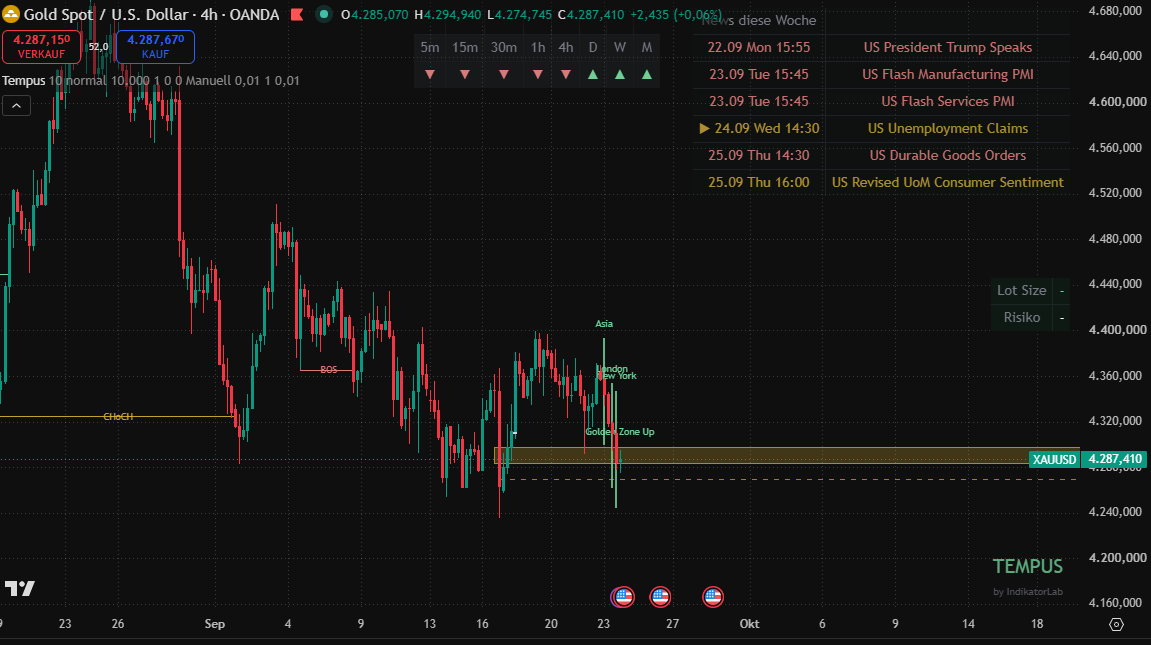
Tempus on the 4-hour chart: golden zone, BOS and CHoCH, the trend dashboard across eight timeframes at the top, the news of the week and the lot size calculator on the right.
Fibonacci golden pocket from 0.618 to 0.705 plus OTE boundary, with direction. Adapts to your timeframe.
Structure breaks only count on candle close, a wick alone is not enough.
The trend from 5 minutes to monthly at a glance.
You enter entry and stop, it calculates lot size and risk. Always rounds down, never up.
The most important events right on the chart. Updated personally by me every week.
Not an automatic list that spits out anything. Every week I go through the calendar and personally enter the important events. That is why you cannot change it: it keeps the box precise.
The complete swing indicator for TradingView.
 Indikator